MNET-VR Multilayer Network Exploration Tool in Virtual Reality
Luca Rossi
Leonard Maxim
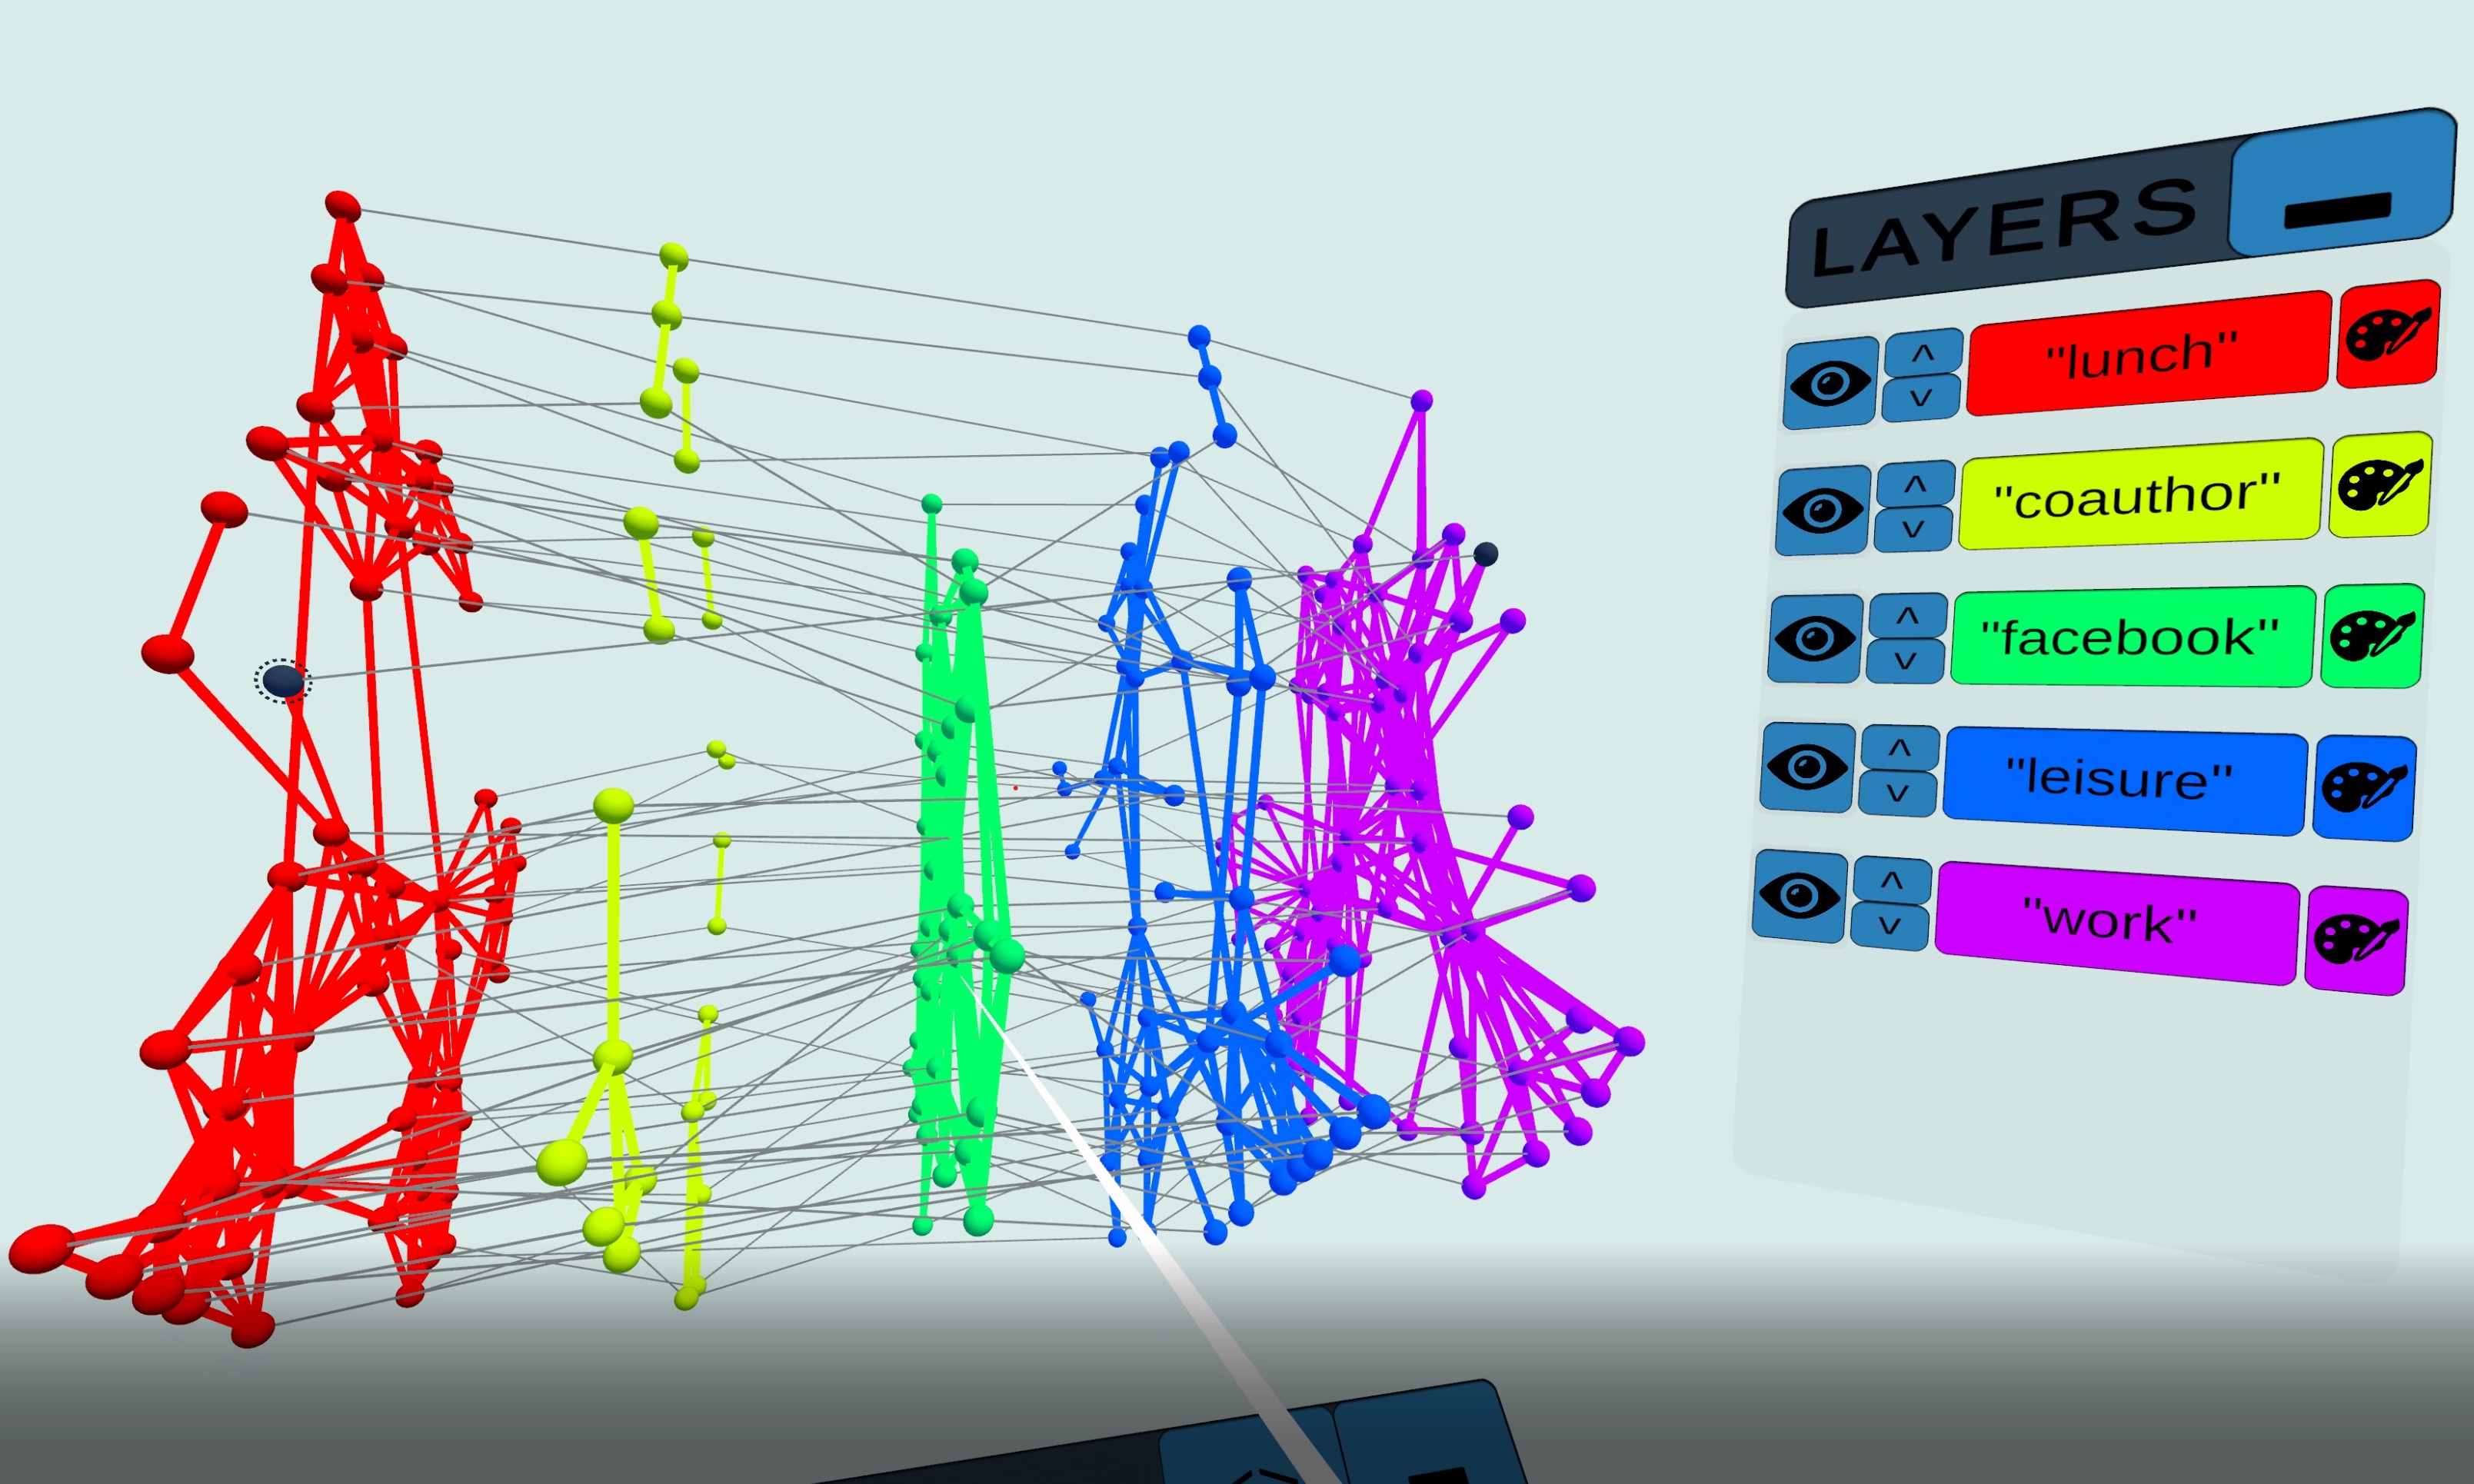
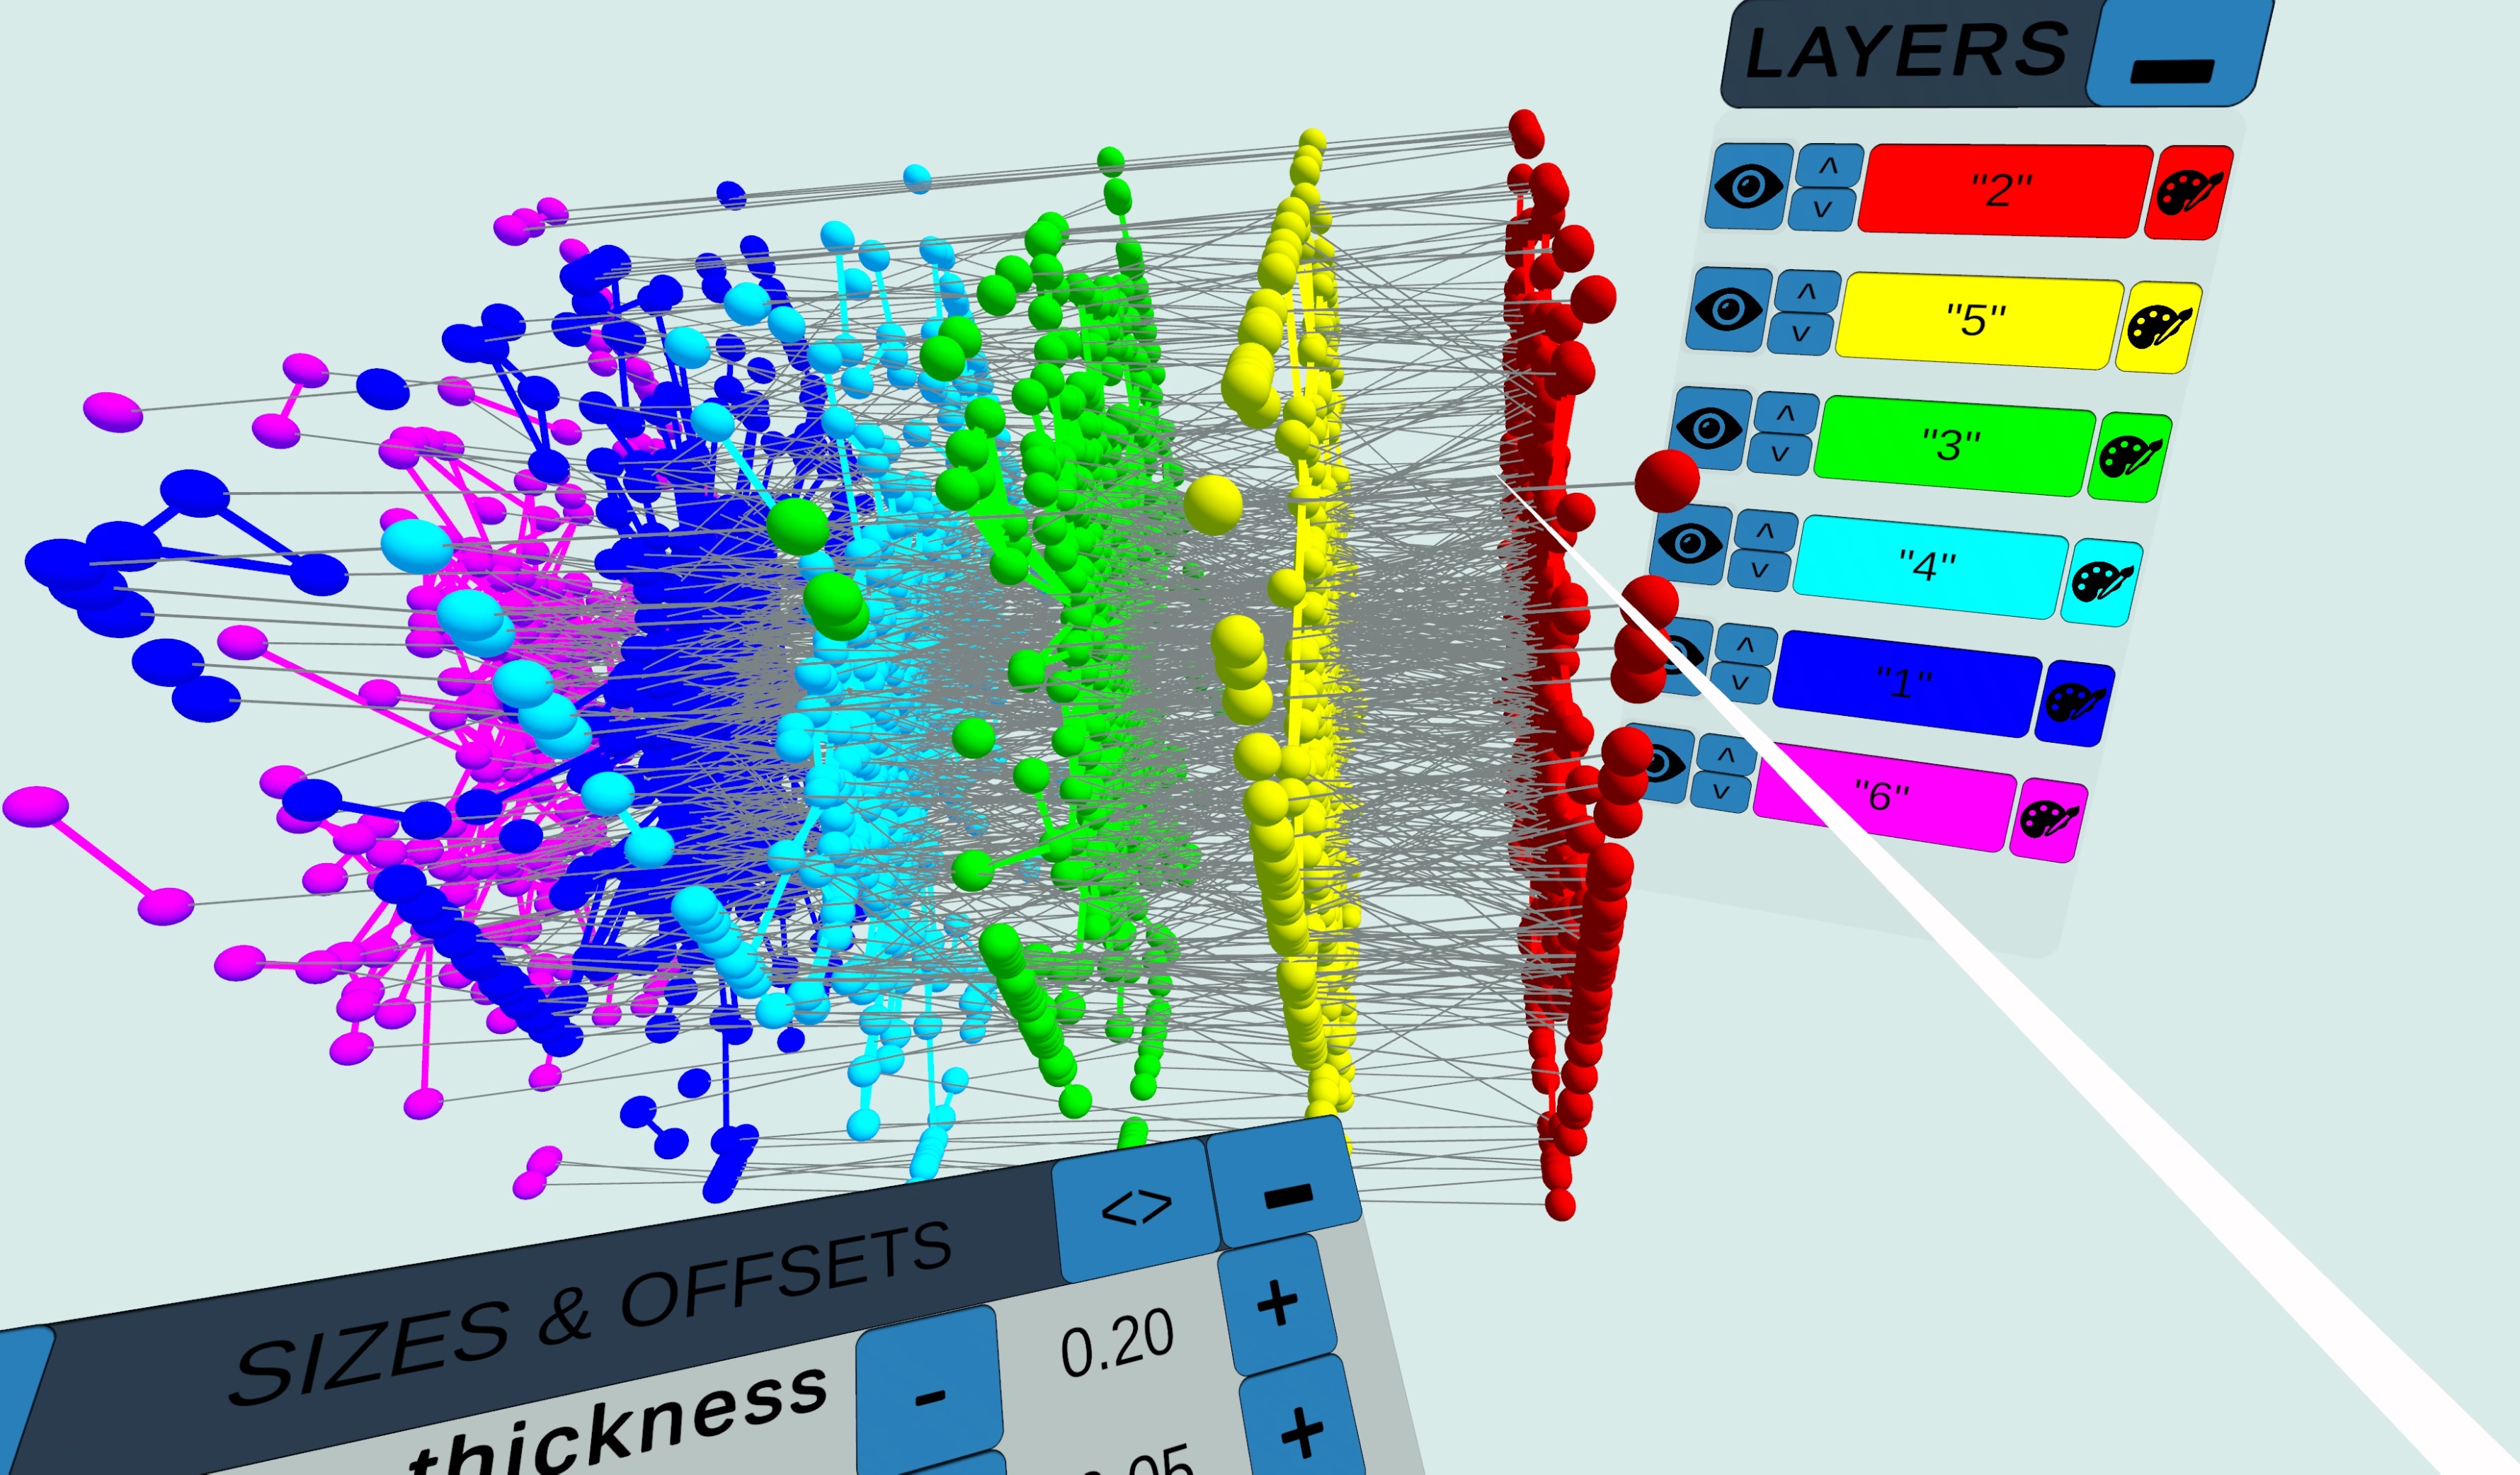
MNET-VR is a tool designed to allow VR visualization and exploration of Multilayer networks. Multilayer networks are an increasingly popular way to model complex relations between various types of entities and they have been applied to a large number of real-world data sets. Their instrinsic complexity makes the visualization of this type of network extremely challenging and still an open research area. MNET-VR is the output of a research project developed at the Networks, Data & Society research group of the IT University of Copenhagen with the goal of exploring the potential of Virtual Reality to deal with this type of network visualization.
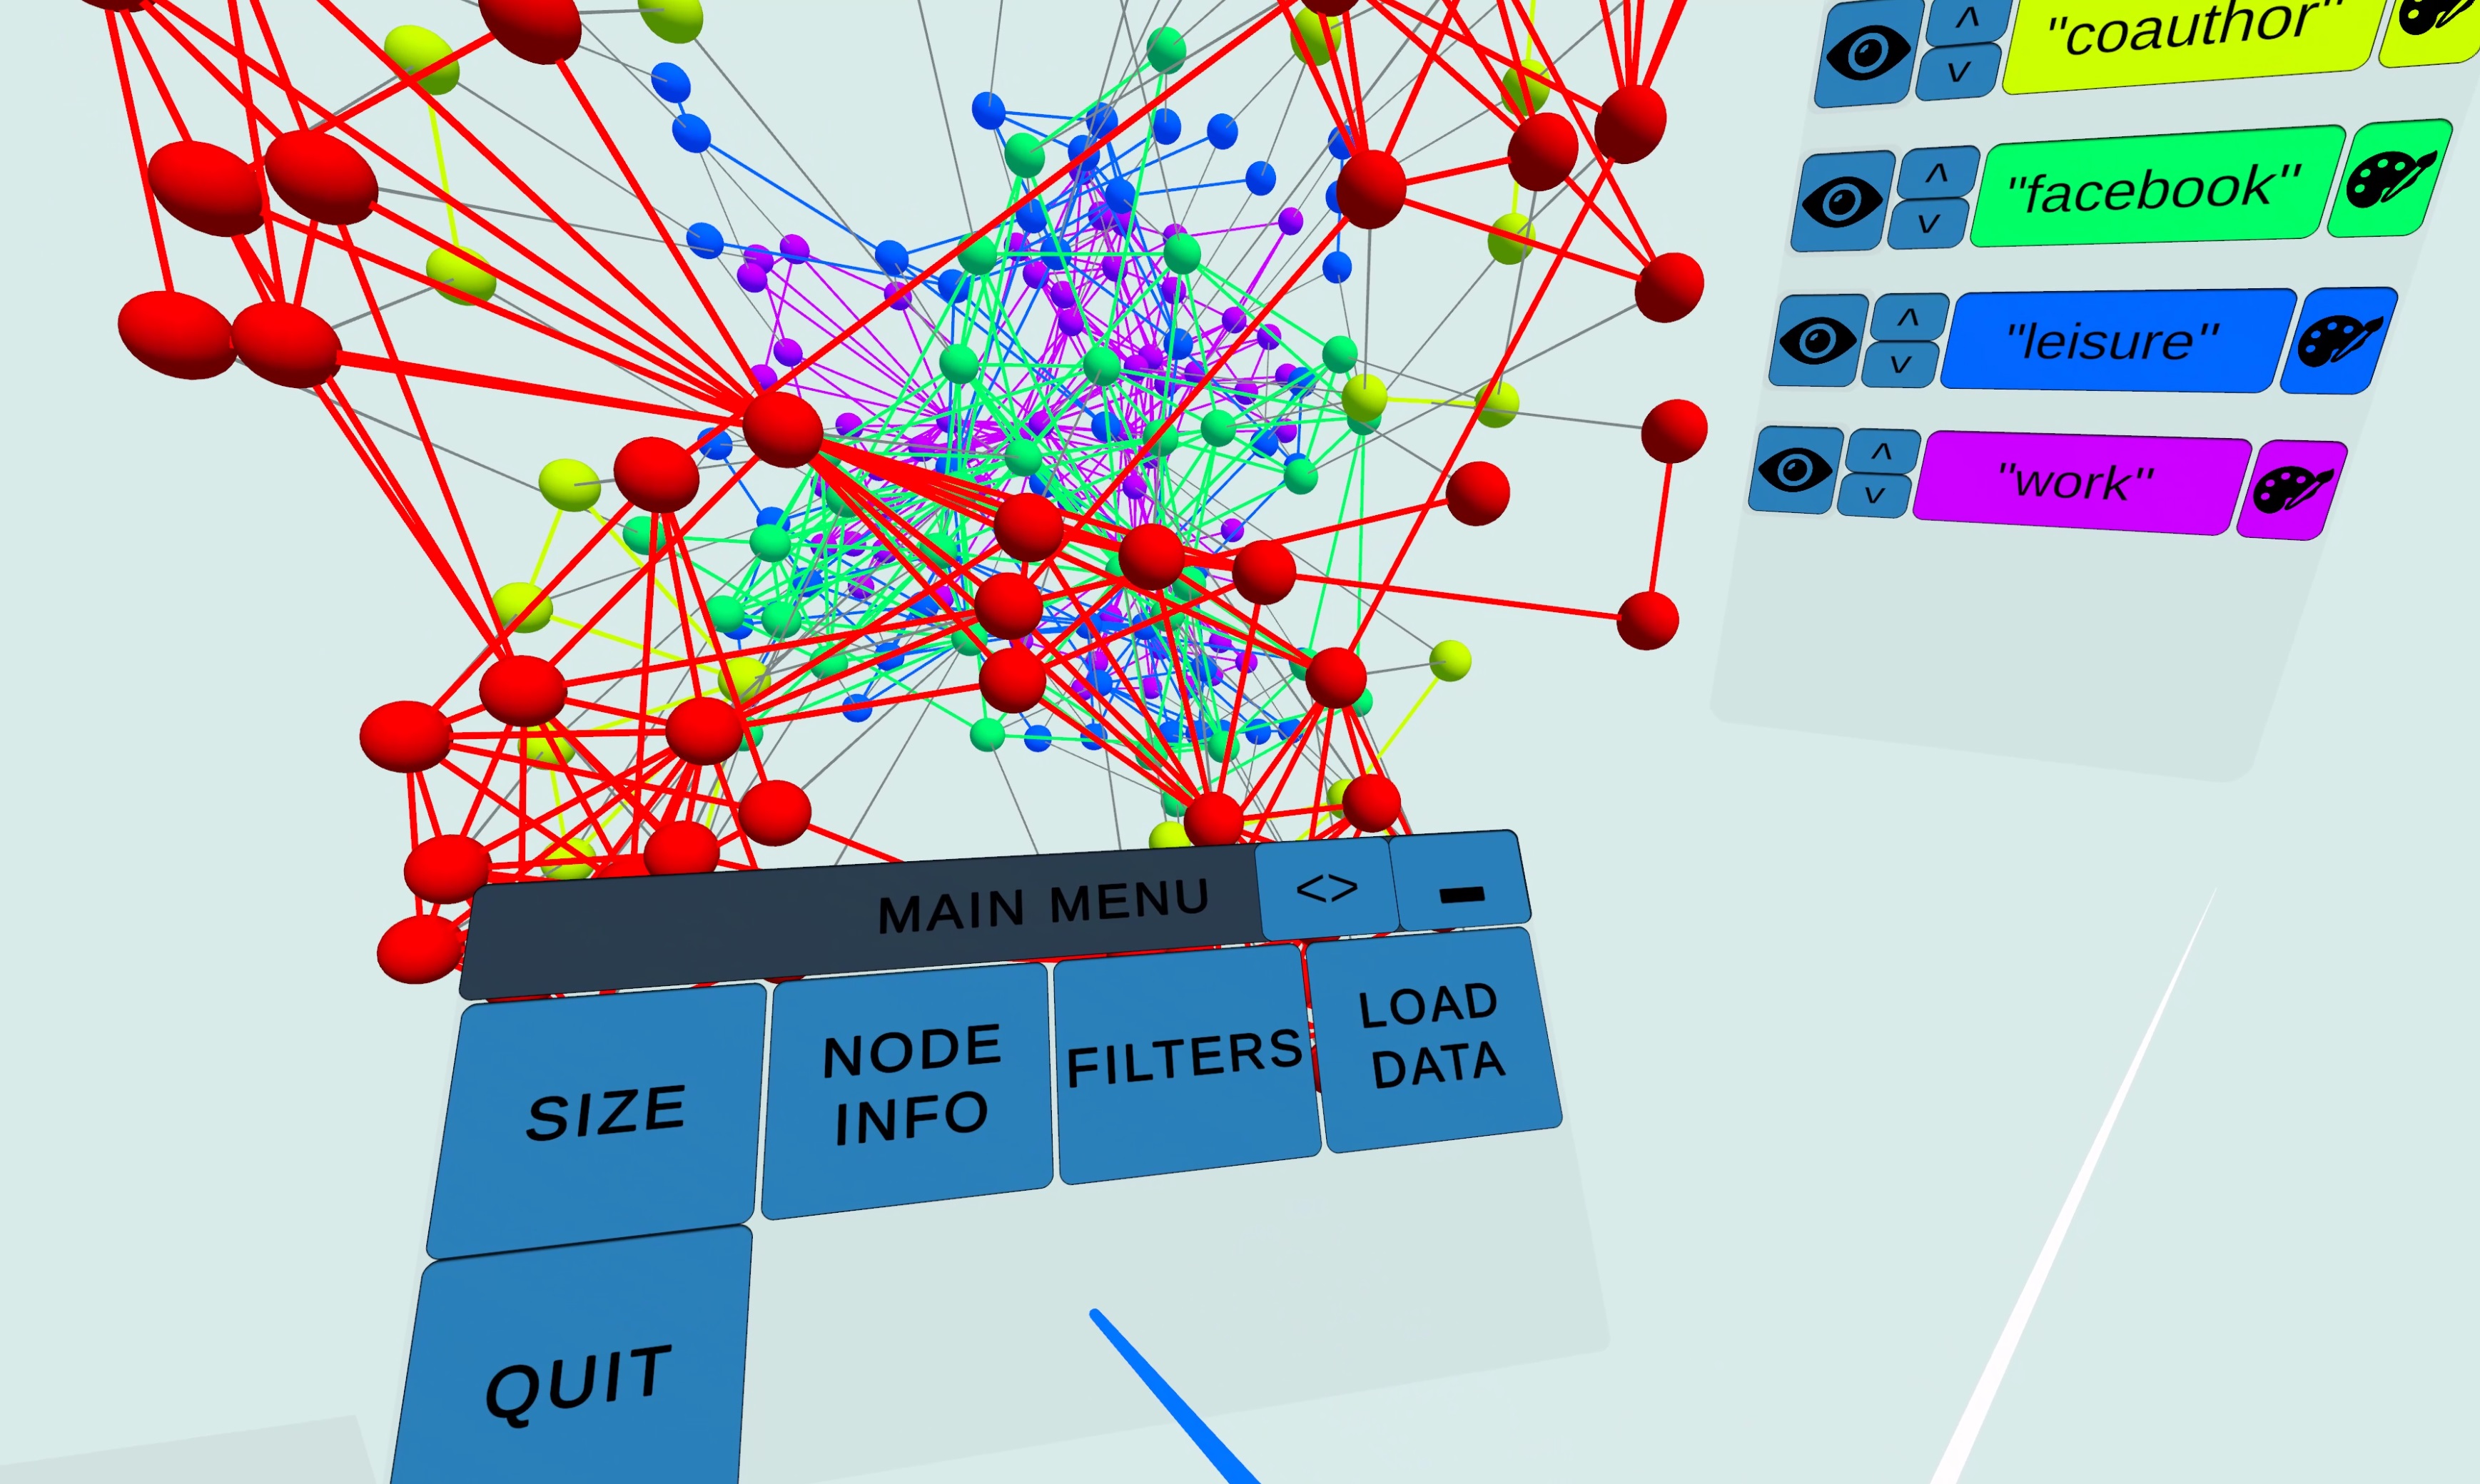
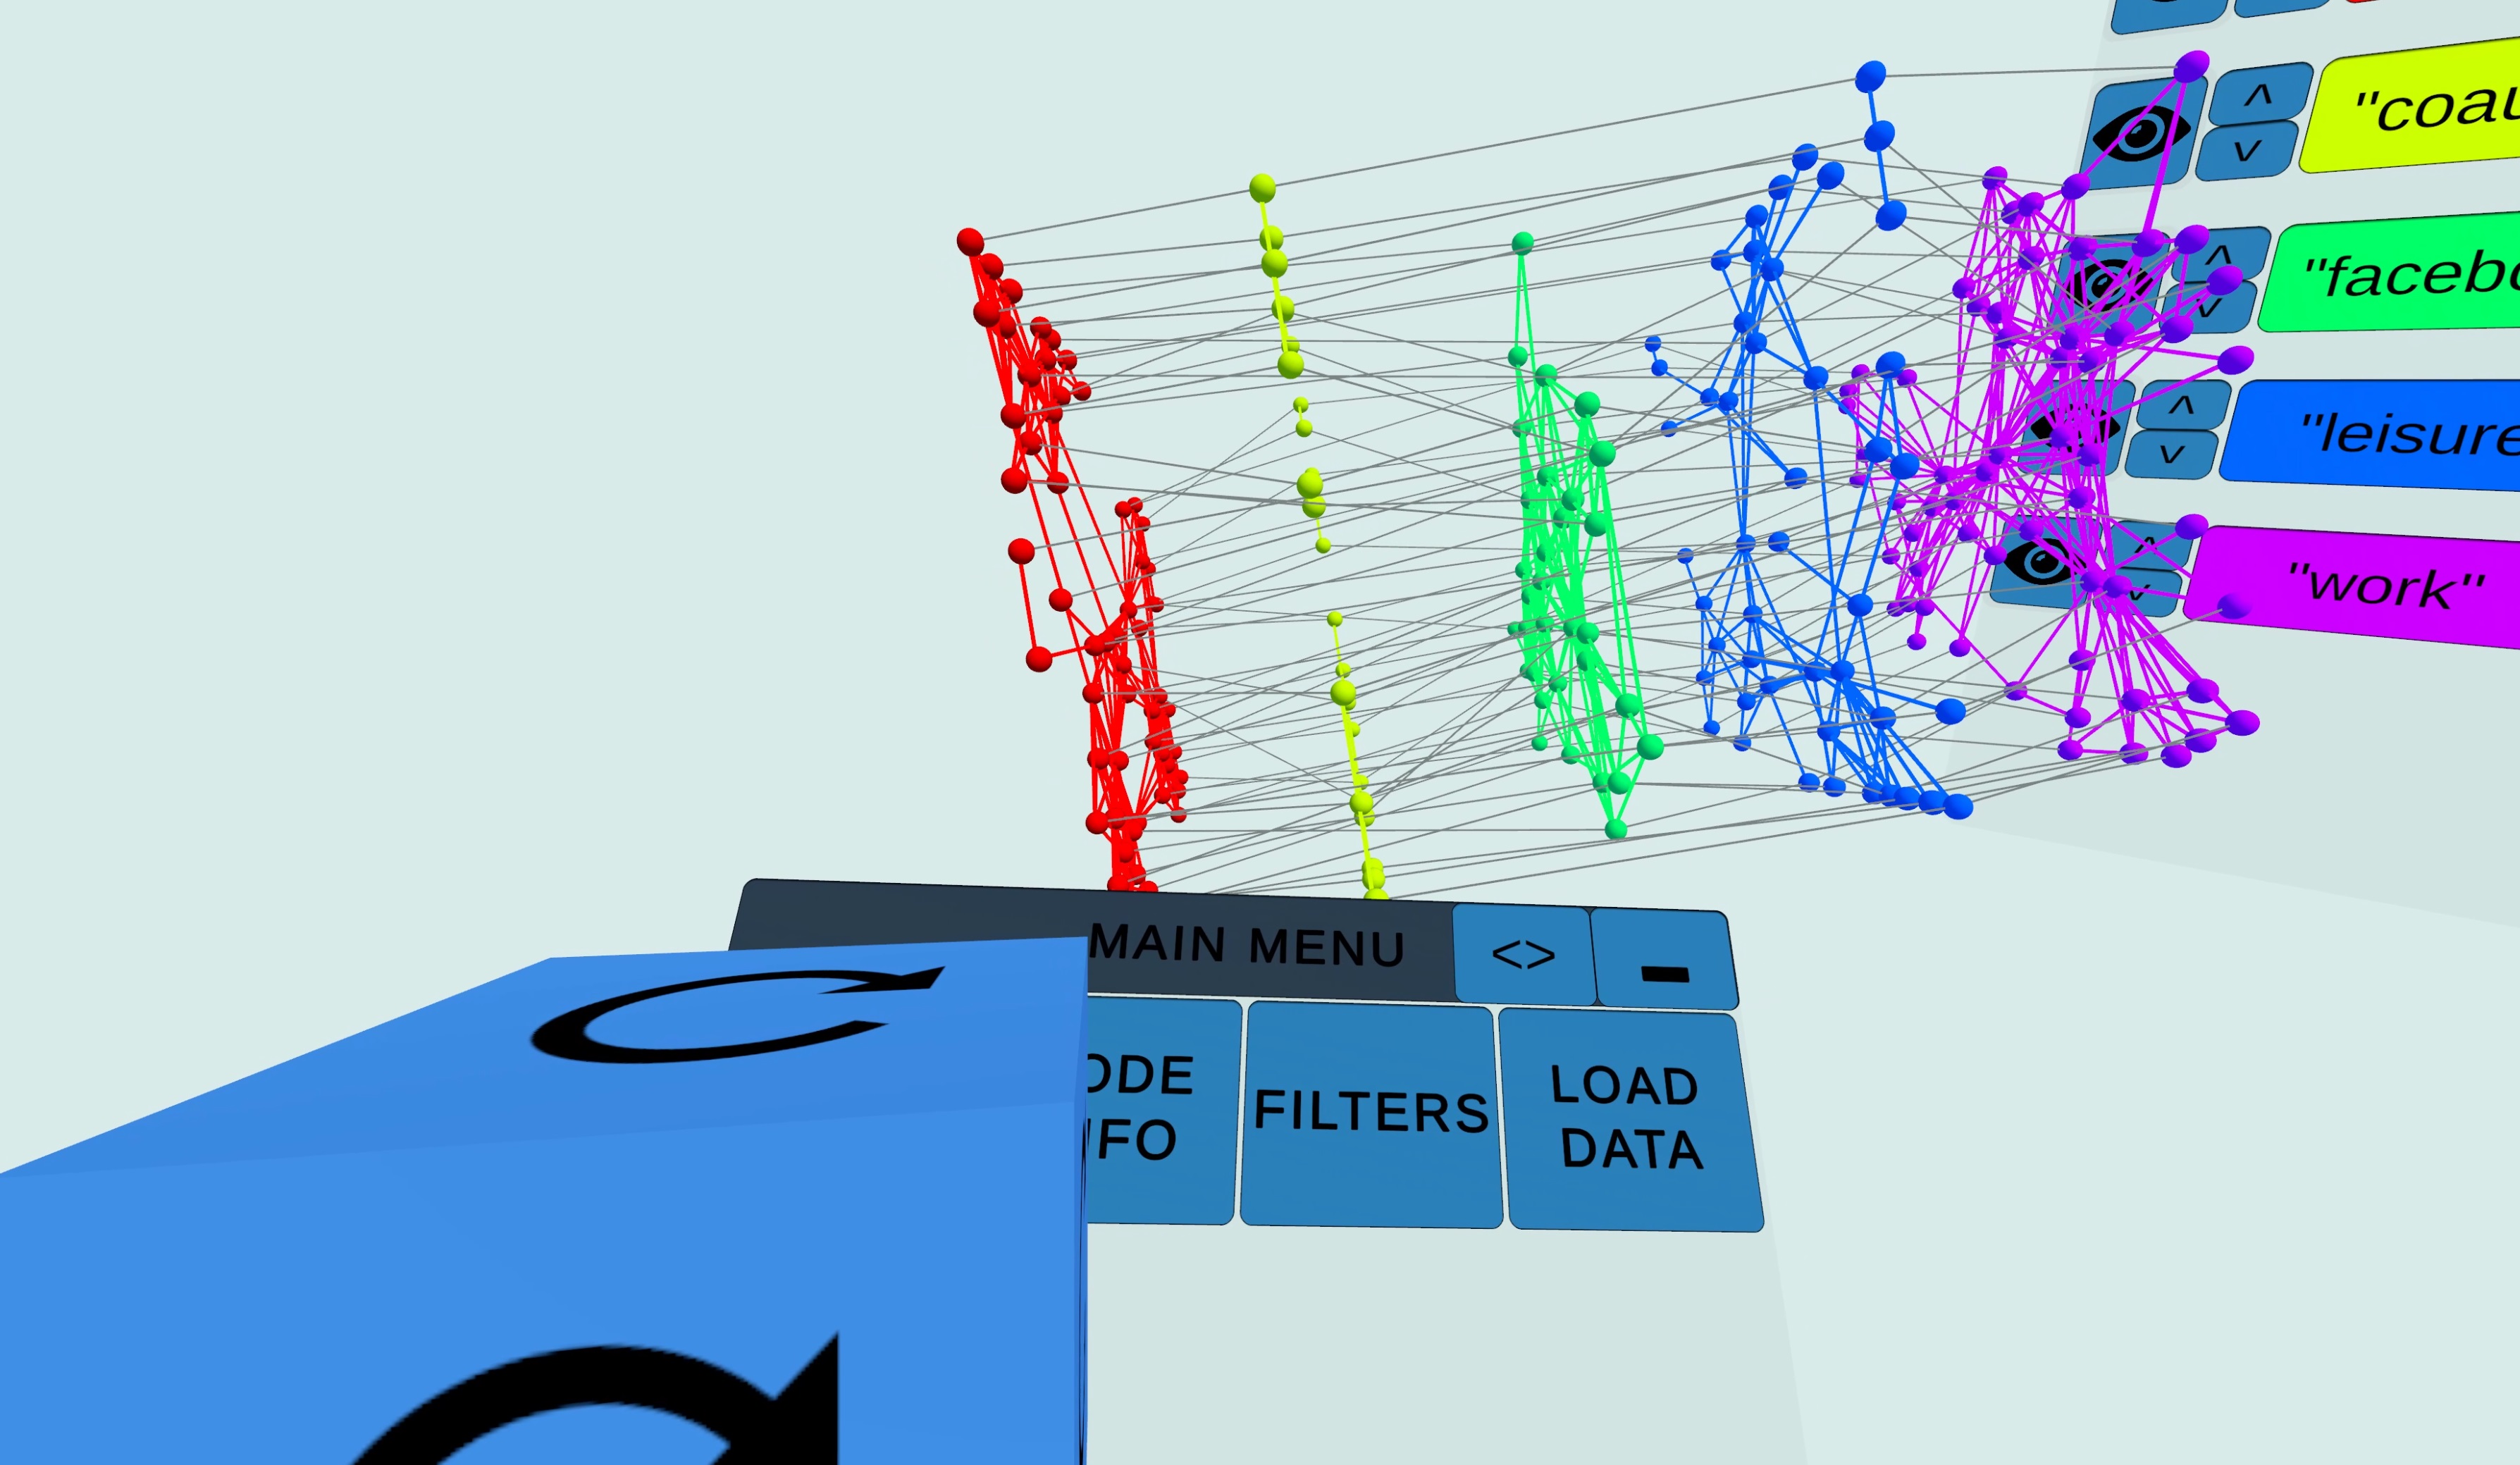
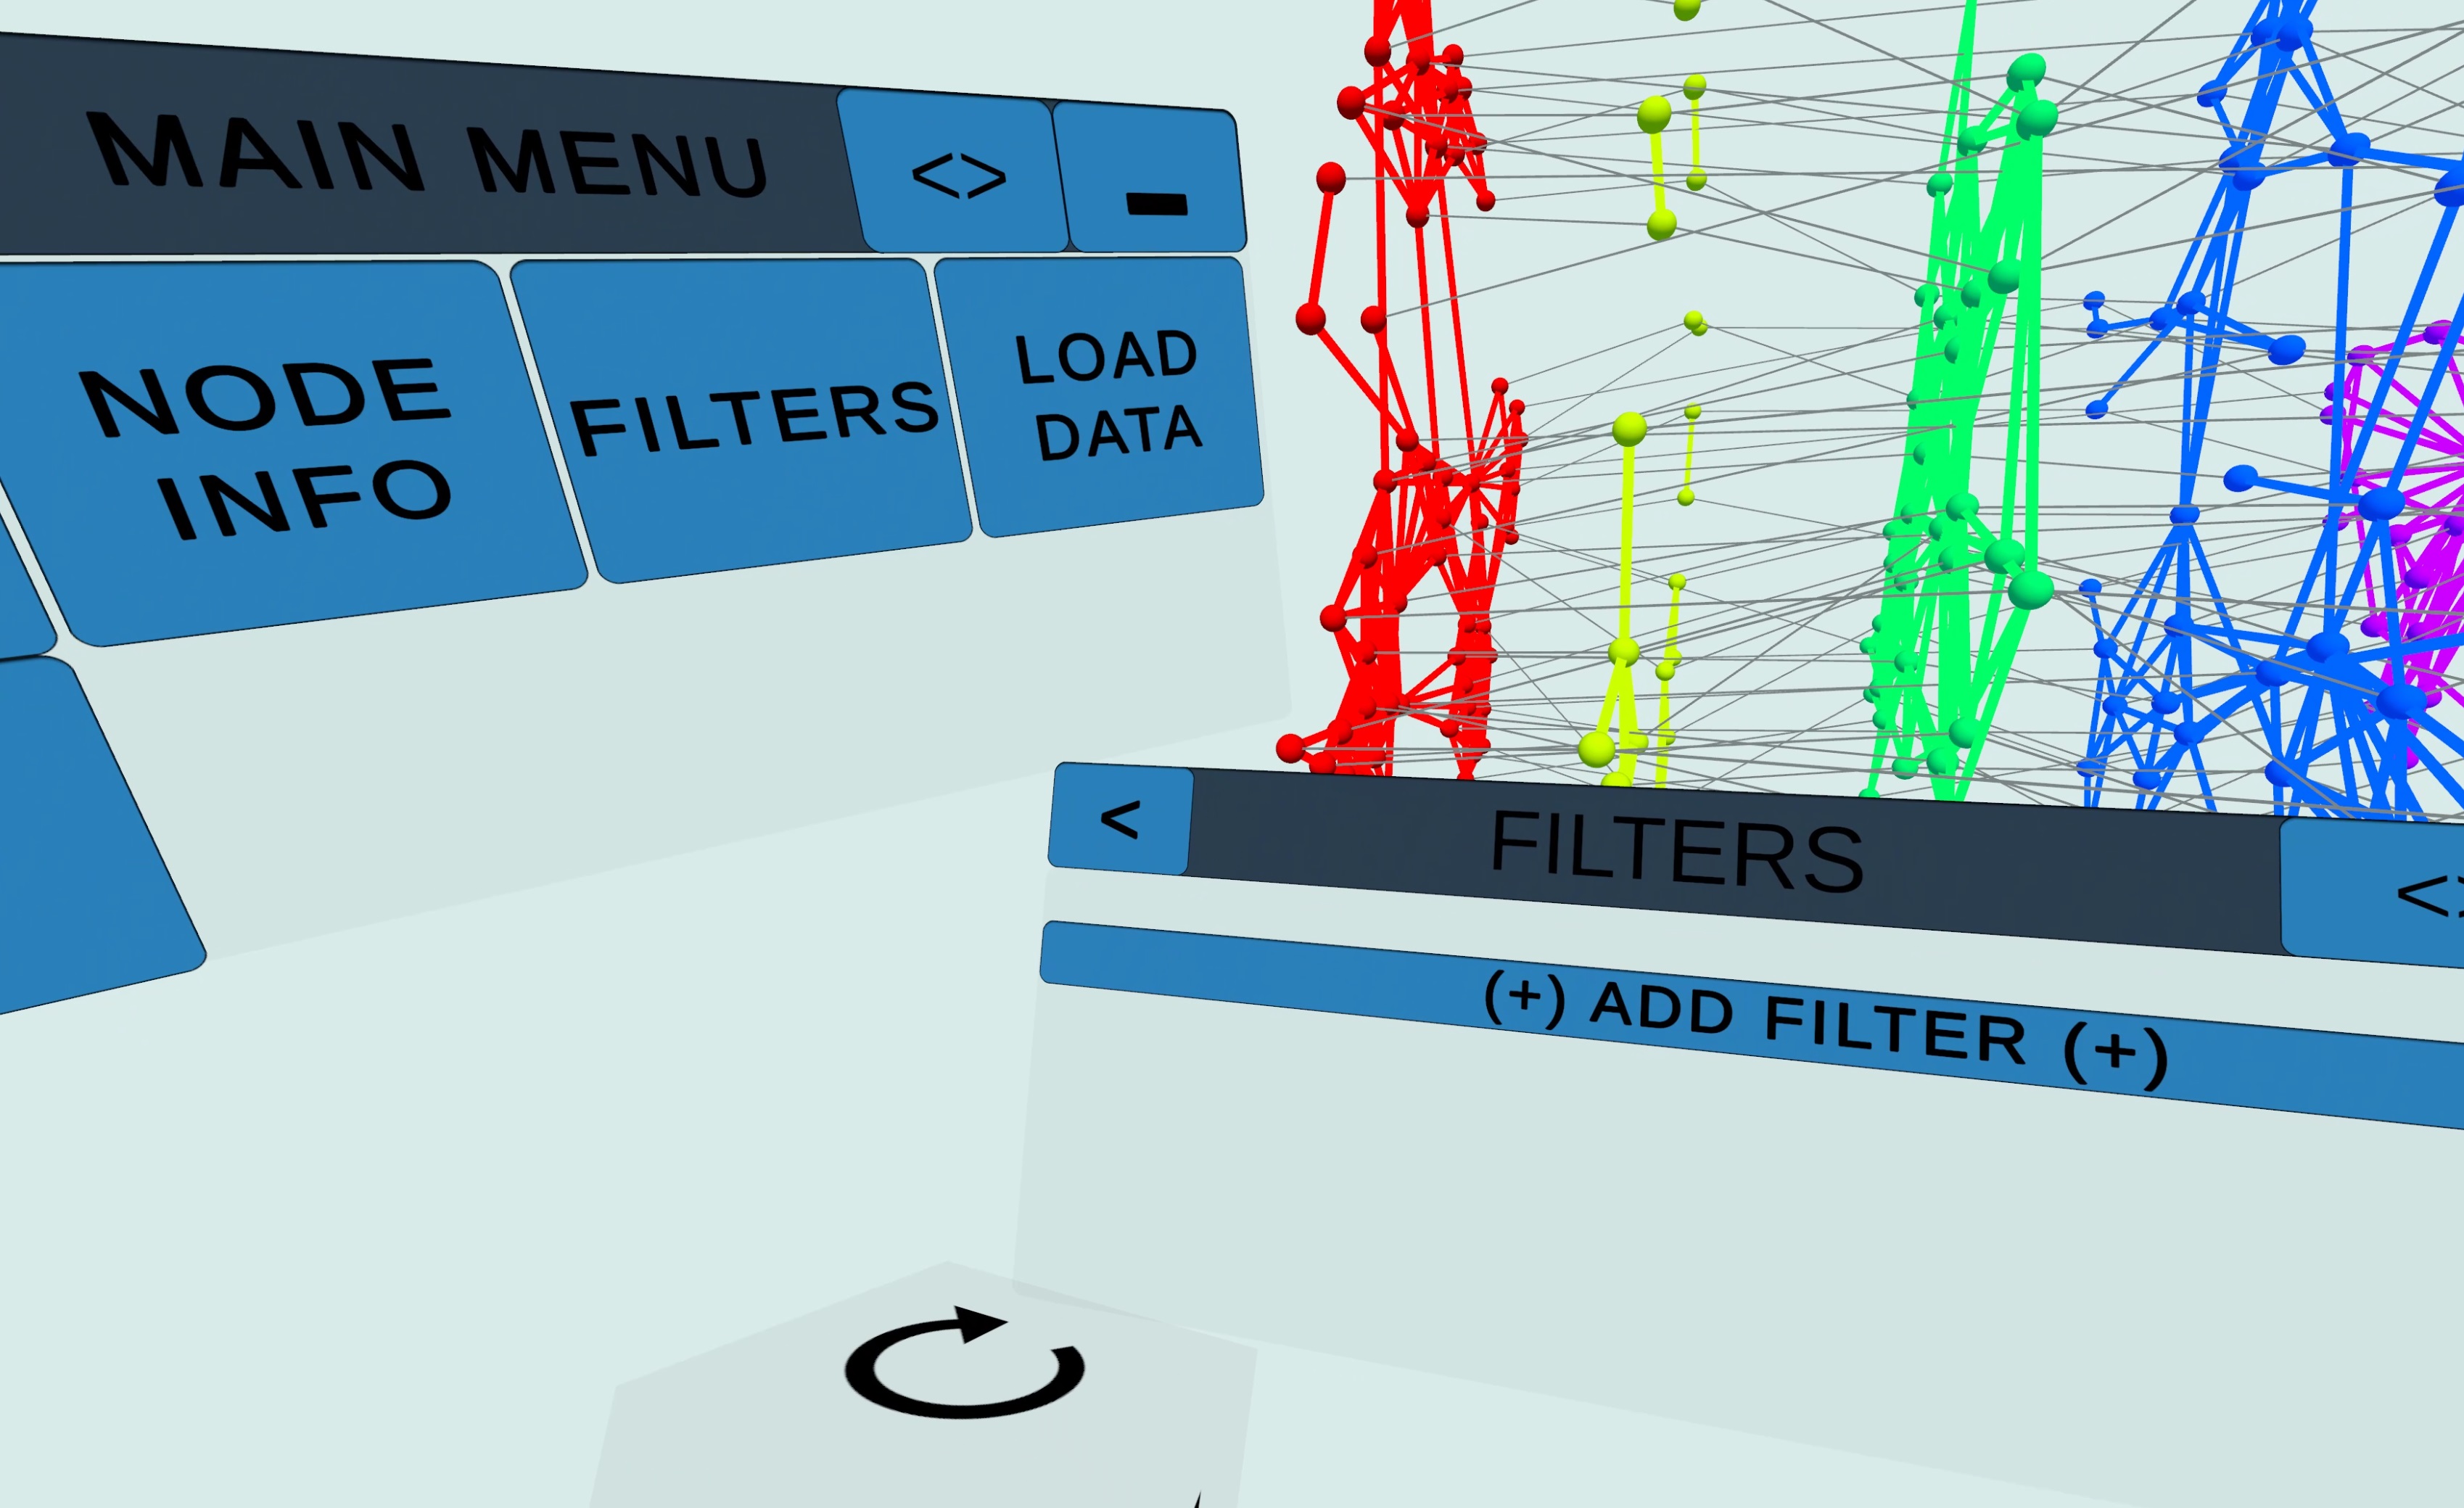
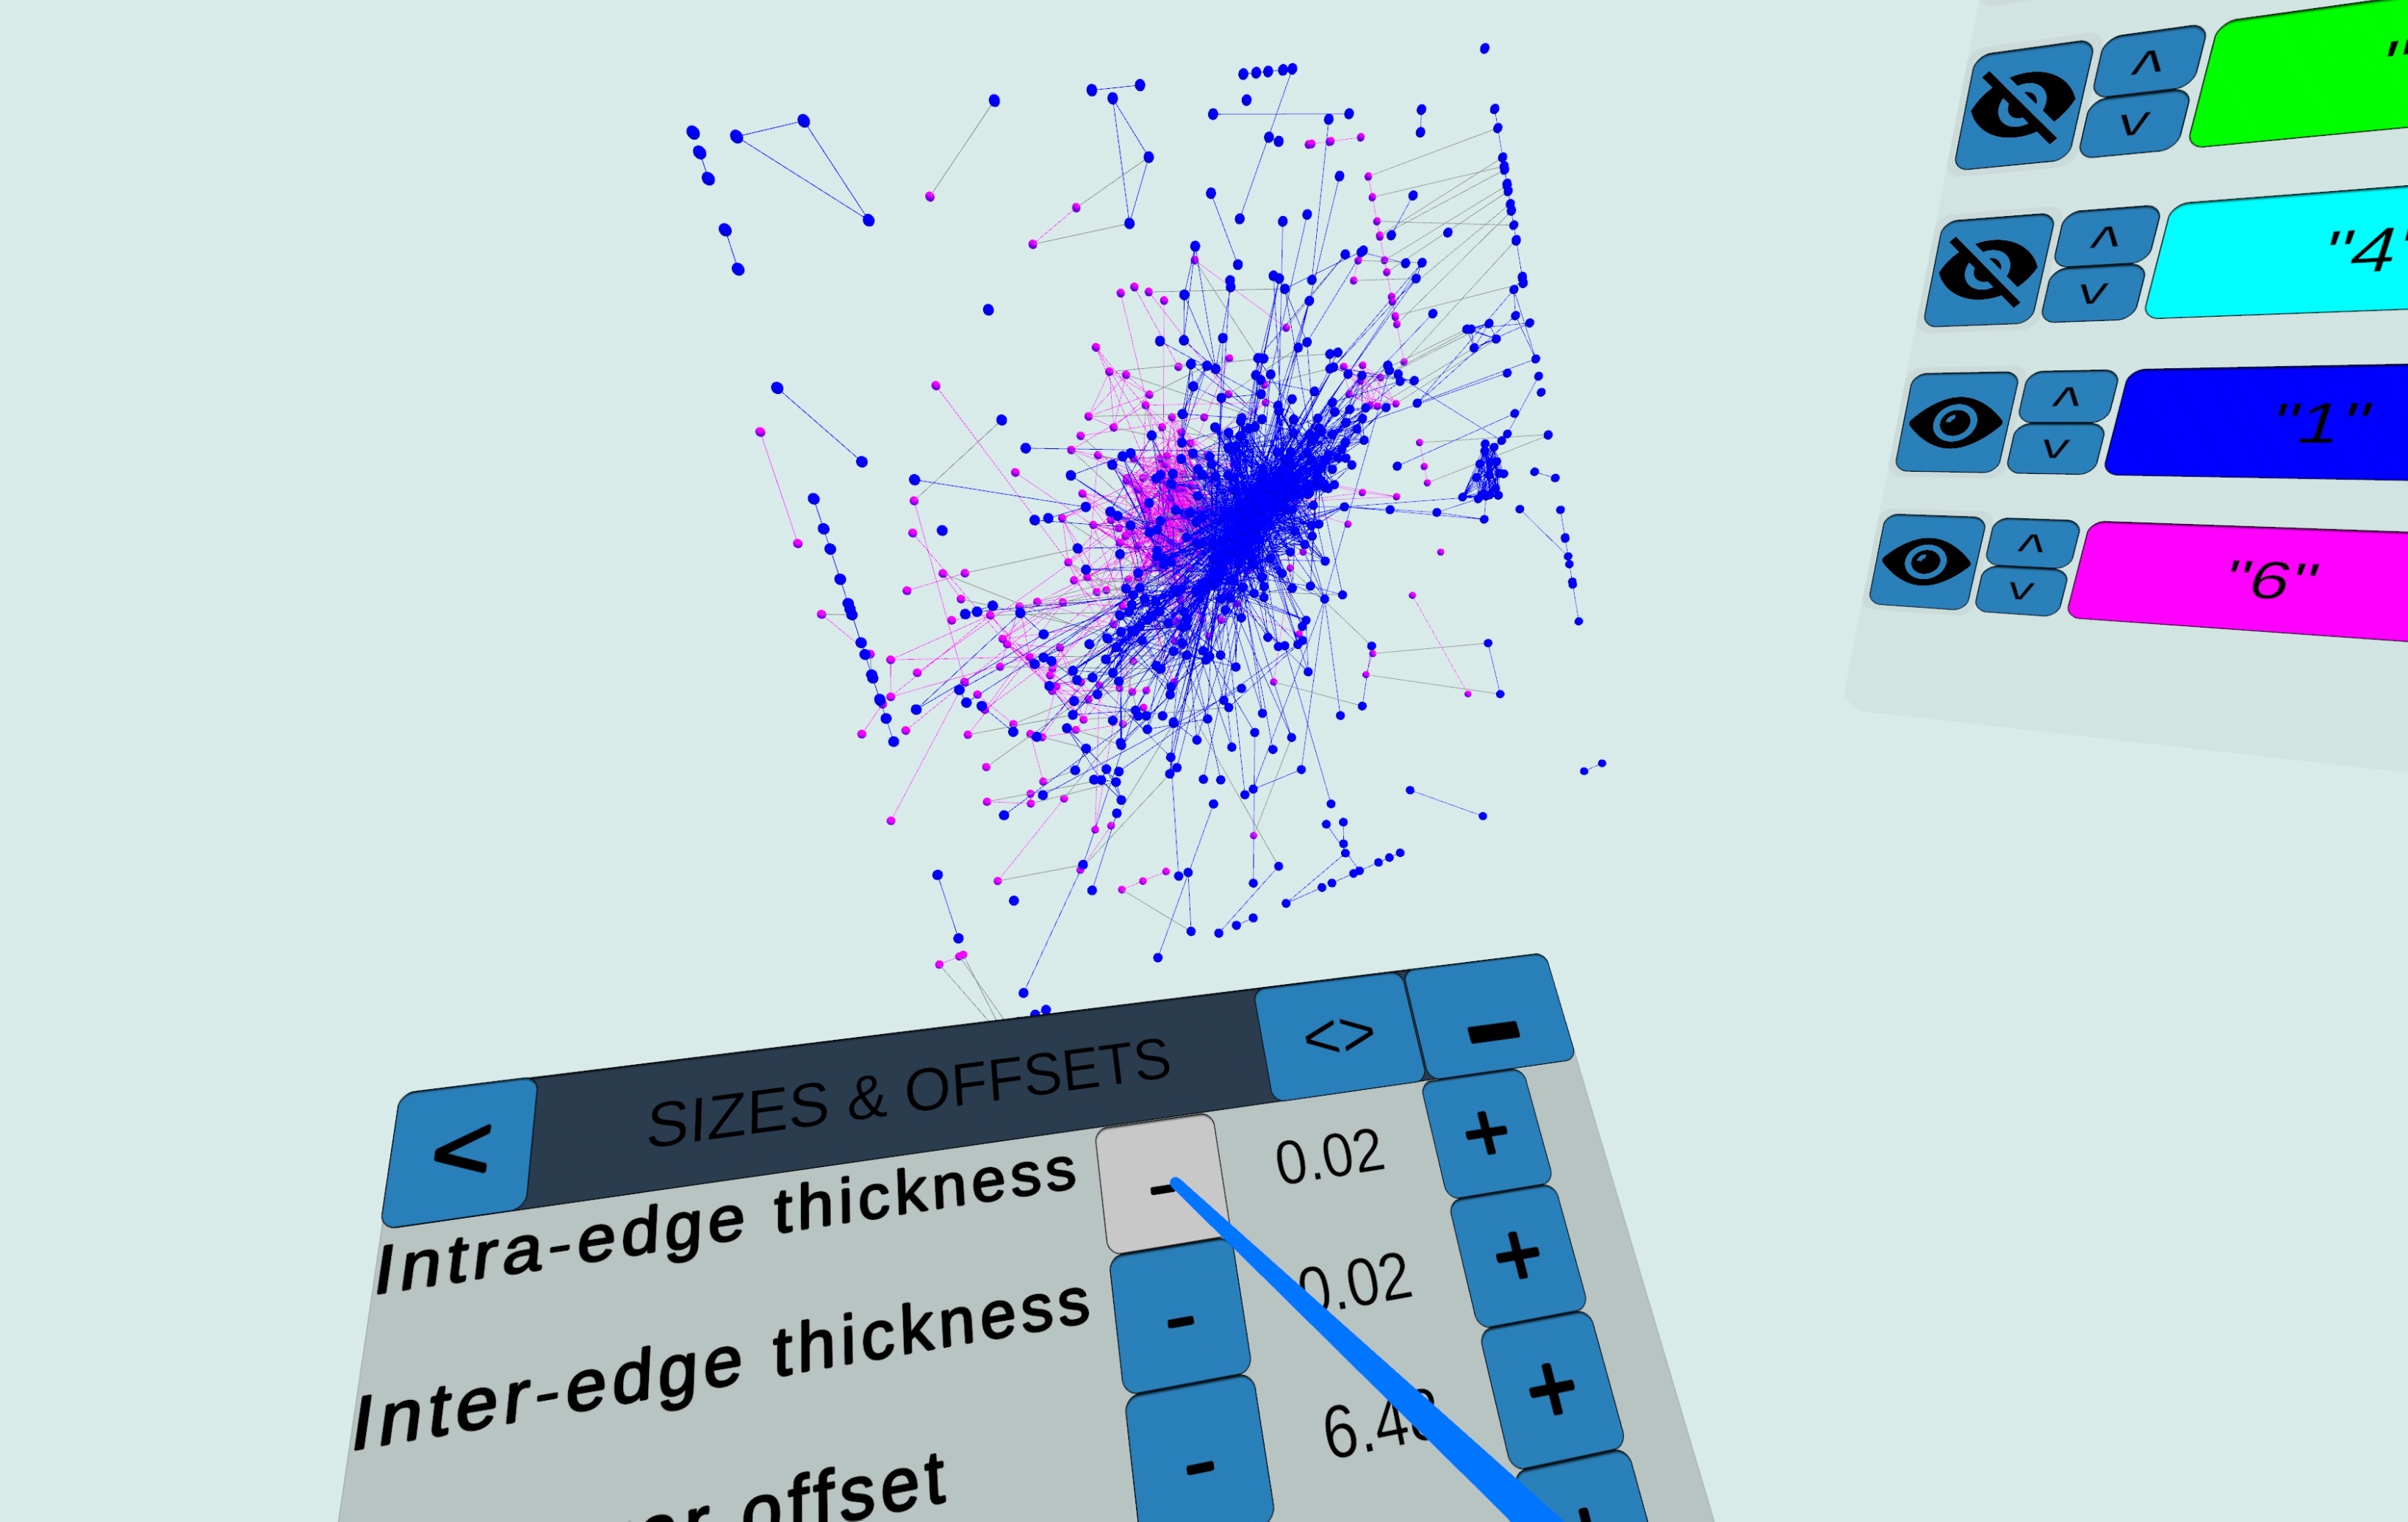
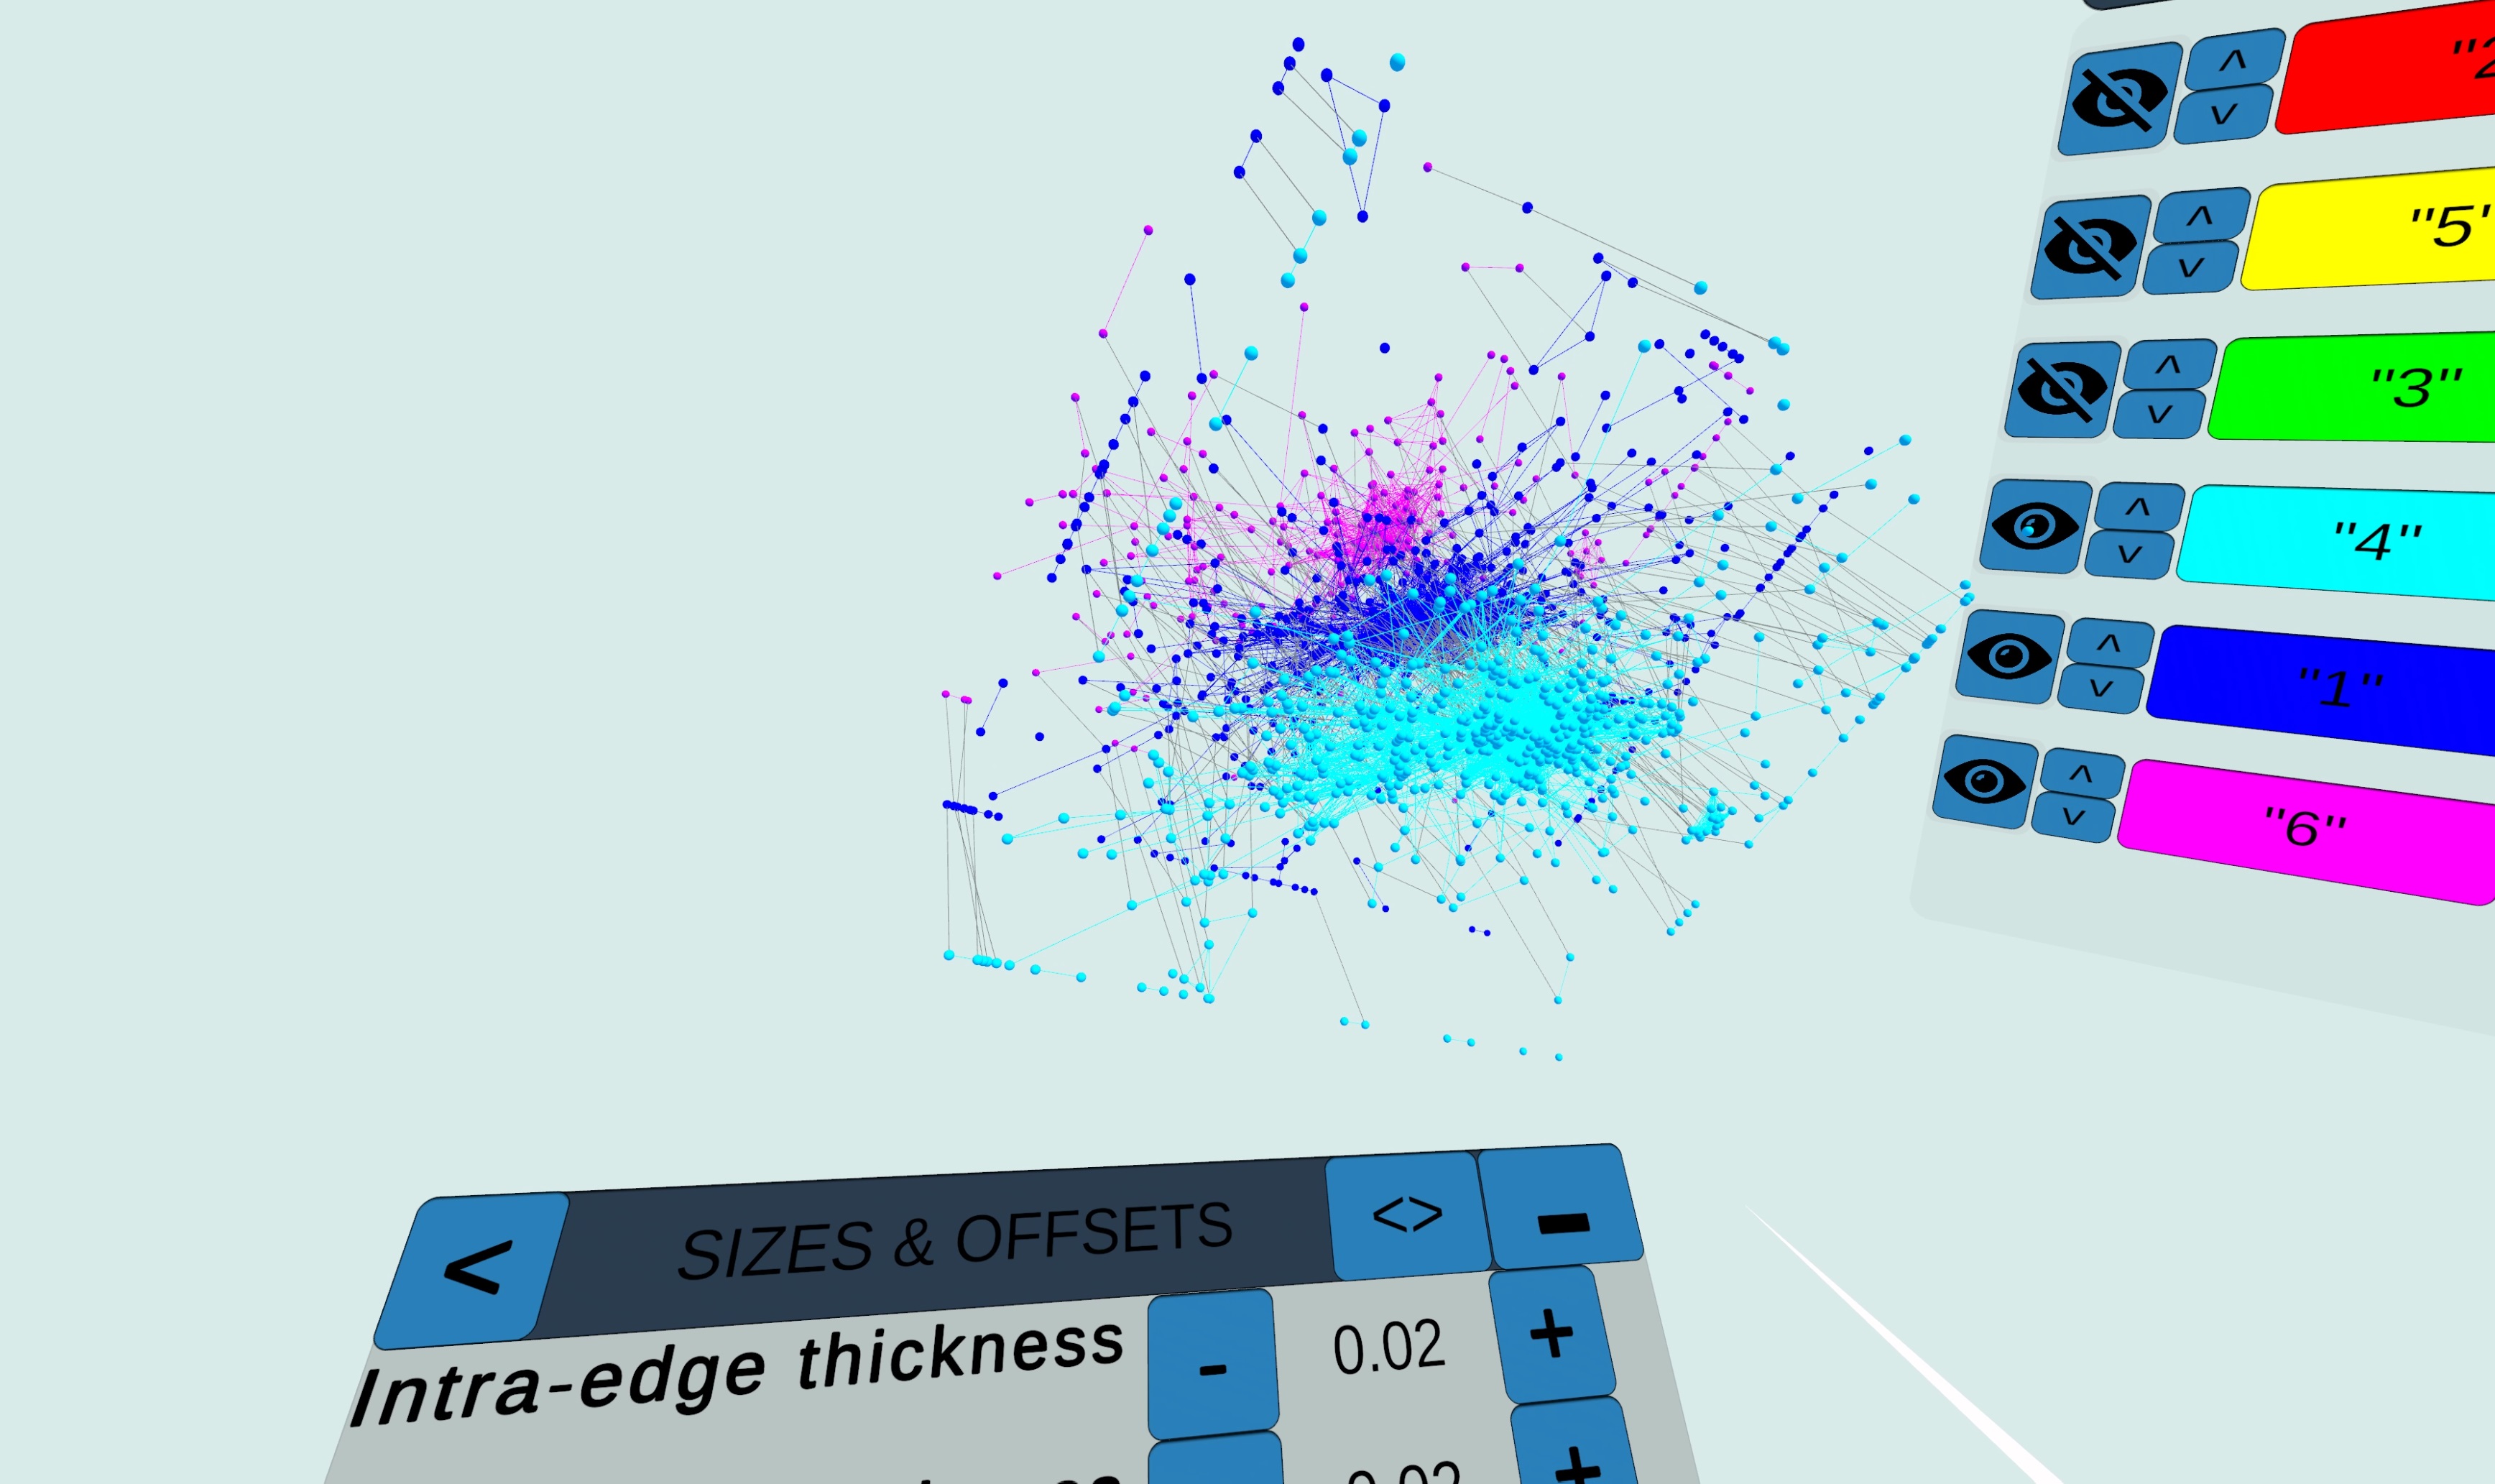
MNET-VR offers basic functions to visualize and filter multilayer network structures. MNET-VR does not offer, at this stage, the possibility to manipulate the network layout. A proper 3D layout of the network can be obtained through the R package multinet. While its primary goal is to explore multilayer networks, MNET-VR can also be used to visualize single layer networks using igraph and multinet.
DOWNLOAD*Only tested on Oculus Quest with Link
TRAILER
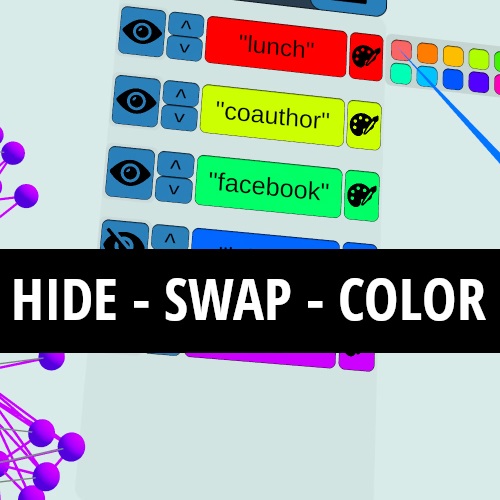
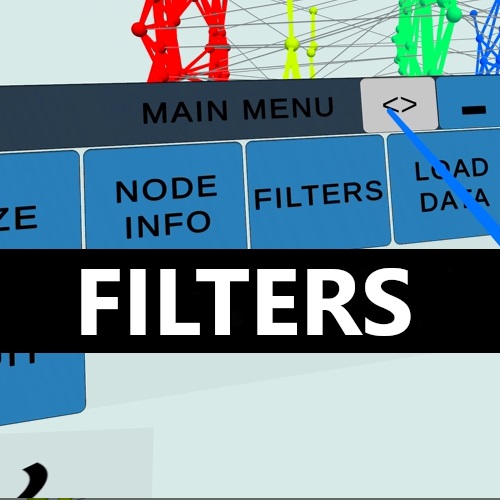
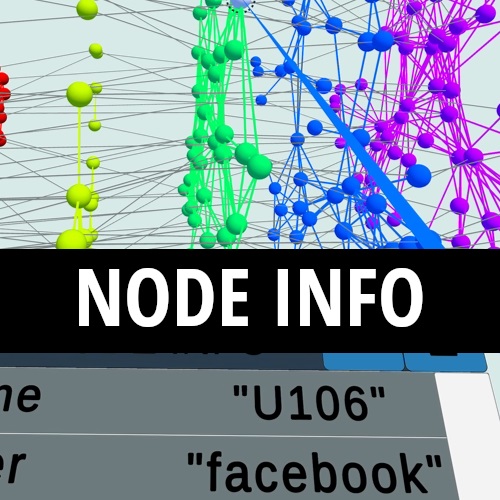
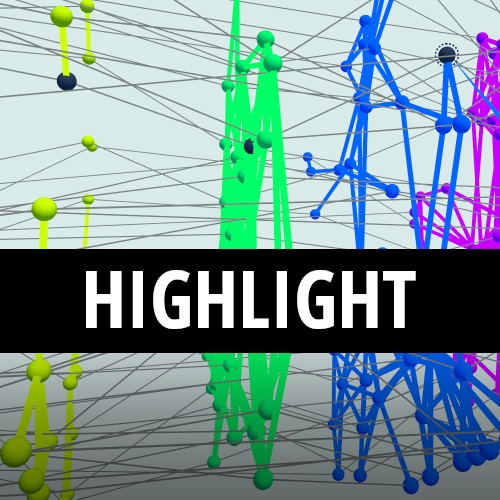
SCREENSHOTS
FILE STRUCTURE
Structurally, the network is made out of two files: one
representing nodes (as a .csv file) and one representing edges
(as a .edges file). Both the nodes and edges files contains a
header representing the structure of the network. For the
nodes (top), each line gives information about the name, layer
and position of an actor separated by an empty space. For the
edges (bottom), each line gives information about the origin
and destination of an edge (split into name and layer) as well
as direction of the edge (at the moment this parameter is
ignored) separated by an empty space character.
You can add new datasets via the following folders:
<instalation_directory>/MNET-VR_Data/Data/edges
<instalation_directory>/MNET-VR_Data/Data/nodes
NODES
"actor" "layer" x y z
"U10" "lunch" -0.6 4.6 0
"U13" "lunch" -4.6 1.7 0
"U10" "coauthor" -1 5 1

...
EDGES
"from_actor" "from_layer" "to_actor" "to_layer" dir
"U102" "lunch" "U139" "lunch" 0
"U102" "lunch" "U33" "lunch" 0
"U106" "lunch" "U118" "lunch" 0

...
TUTORIALS

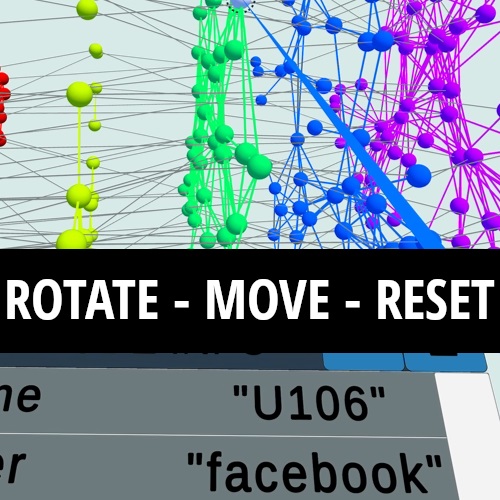
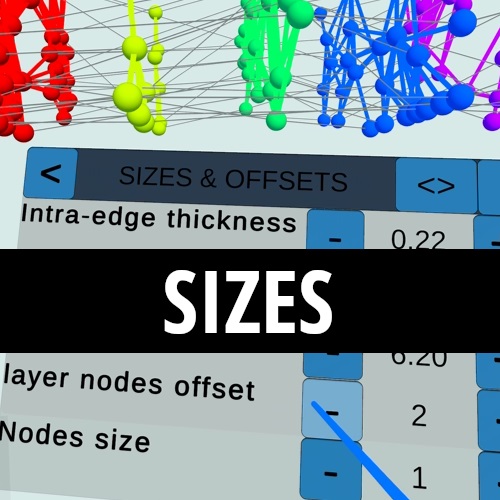
Learn how to manipulate data by changing distances between layers/nodes, sizes of nodes and thickness of edges.
Learn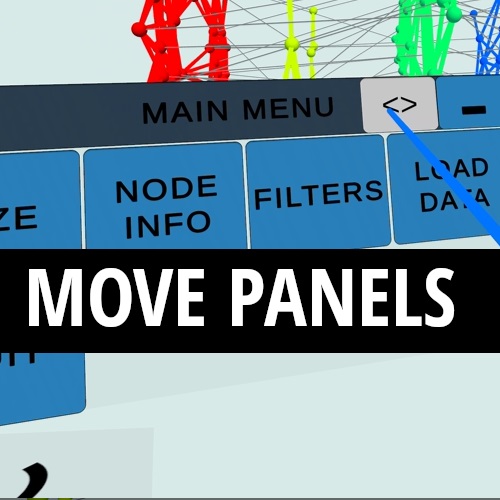
EXPORTING YOUR NETWORKS
MULTINET
ml_export_to_VR <- function(net,w_inter){

  library(multinet)
  library(readr)

  nodes <- layout_multiforce_ml(n = net,w_inter = w_inter)
  edges <- edges_ml(n = net,layers_ml(net))

  write.table(nodes,file=paste0(deparse(substitute(net)), ".csv", sep=""),row.names = F,sep = " ")
  write.table(edges,file=paste0(deparse(substitute(net)), ".edges", sep=""),row.names = F,sep = " ")


}
IGRAPH
igraph_export_to_VR <- function(g){
  library(igraph)
  library(multinet)
  library(readr)

  net <- ml_empty()
  if(is.null(V(g)$name)){V(g)$name <- V(g)}

  add_igraph_layer_ml(n = net,g = g,name = deparse(substitute(g)))

  nodes <- layout_multiforce_ml(n = net,w_inter = 1)
  edges <- edges_ml(n = net,layers_ml(net))

  write.table(nodes,file=paste0(deparse(substitute(g)), ".csv", sep=""),row.names = F,sep = " ")
  write.table(edges,file=paste0(deparse(substitute(g)), ".edges", sep=""),row.names = F,sep = " ")


}
FEEDBACK AND CONTACT
If you find any bugs or if you have suggestions/thoughts/ideas, please contact us:
Luca Rossi: lucr@itu.dk
Leonard Maxim: contact@leonardmaxim.com